As we’ve covered recently, universal Google Analytics is going away July 1 of 2023. This means, if you haven’t already begun preparing, you need to do so ASAP.
With that in mind as you migrate to the new GA4 that’s replacing it, here are some key metrics we recommend tracking and changes to note in the new platform.
(Image Source: roastmylandingpage.com)
A reminder of what’s changing
When moving to GA4, you’ll immediately notice that the whole interface is new. We empathize with the fact that a changing interface for anything can be a pain — but in the end, it’s for an upgrade that will help you in the long run. And besides, you’ll naturally adapt to that quickly on your own; today we want to focus on the metrics.
In the old Universal Analytics, you had these metrics available to track:
- Total users
- New users
- Page views
- Sessions
- Average session duration
- Goals
- Conversions
- Event count per action
- Bounce rate
Now, you have a new set. There’s plenty of overlap with the old metrics as you’ll see right away, but they include:
- Total users
- New users
- Active users
- Session start
- Views
- Events (AKA conversions)
- Engagement rate (AKA bounce rate)
- Average engagement time (AKA average session duration)
- Lifetime value
- Pages per session
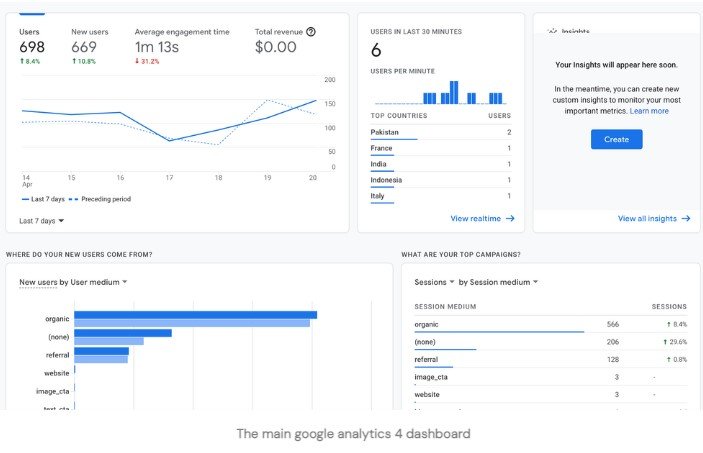
(Image Source: measureschool.com)
These new ones mean the following:
Total users, rather self-evidently, is the number of unique visitors you receive within a time period, while new users is the number of unique first-time visitors.
It’s active users, though, that’s the primary user metric for GA4 — this is different from total users because it measures people who’ve actively engaged in a session. Here, an engaged session means they’ve spent 10 seconds or more on your site, visited multiple pages, or converted. (And that, of course, comes back to the engagement rate, another metric listed above.)
That then is related to the average engagement time, which is exactly what it sounds like: How long is the average session?
Session start tells you which session each event comes from. Each session ends when there has been 30 minutes of inactivity; if a user comes back after a session is timed out, a new session will start.
Views is the total number of web pages (or app screens, if relevant) your users saw.
Then you have events, also called conversions. GA4 will count every instance of a conversion event — for example, if a user submits a form twice it will count as two distinct conversions. Obviously, this can cause overlap, so you have to set up specific events to count the number of conversions. For this reason, clearly define your events!
Lifetime value then, is a helpful bottom line that simply shows you how much revenue each customer visiting your site has generated.
Lastly, the pages per session is helpful if you have a larger site. This shows how many pages a user sees in a 30-minute session.
Tracking metrics based on intent
Of course, each of these metrics have different utilities depending on what you’re trying to achieve. A campaign to introduce a brand to a wide array of new people will of course judge success based on different things than a campaign to sell already-loyal customers on a specific product, for example.
We like to break these all down into categories that help you organize which metrics are helpful for what you’re trying to achieve. These can be thought of as metrics for acquisition, engagement, monetization (e-commerce), retention, and demographics.
Acquisition metrics include:
- New users
- Engaged sessions
- Engagement rate
- Average engagement time
- Engaged sessions per user
- Event count
“New users” is quite intuitive — it is, after all, practically a synonym; what are you acquiring? New users! The others can bleed into engagement metrics (coming next) but are still useful proxies to use in conjunction with tracking new users too so that you can understand said new users more in-depth.
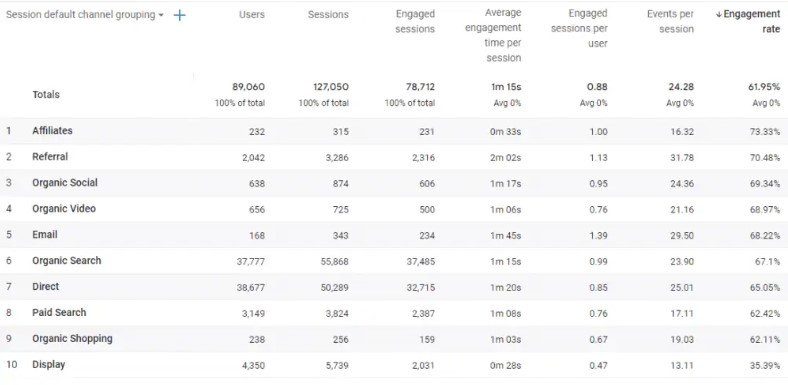
Now for those engagement metrics:
- Users
- Views
- Views per user
- Average engagement time
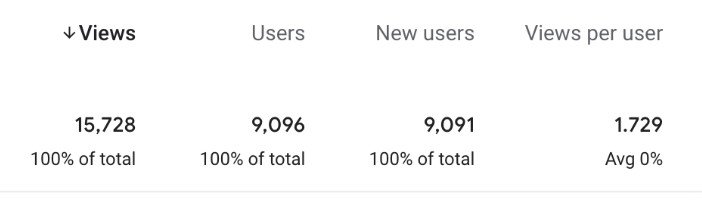
(Image Source: roastmylandingpage.com)
As you can see, these are quite straightforward. They each look at how engaged visitors are, each from a different scope. Altogether, they’re also an important foundation to understand the context of what you see in other metrics.
Monetization metrics for e-commerce are also pretty self-explanatory:
- Item views
- Add-to-carts
- Cart-to-view rate
- E-commerce purchases
- Purchase revenue
- Item promotion clicks
Each of these directly concerns purchasing and the details thereof. Pretty straightforward.
Retention metrics, on the other hand, can seem to bleed into the realm of engagement metrics. They are:
- Returning users
- Monthly active users (MAU)
- Weekly active users (WAU)
While their parameters are less clear-cut than, say, monetization metrics, it’s still apparent the principle behind retention ones. Returning users is obvious, but by keeping up with your monthly or weekly active users, you can also note any trends upward or downward.
Lastly is demographic metrics, which takes us back to the “pretty self-evident” category:
- Age
- Gender
- Interests
All of these are inherently demographic measures, so it makes sense.
This is just a quick look at metrics to note while adapting from UGA to GA4. While these will help with your transition, the other thing that will help is switching to GA4 from the old system as soon as possible if you haven’t already. And, when you do so, make sure your events are being tracked as you make this change.
We believe you’ll quickly come to appreciate the tools GA4 brings to the table, but we also know that change can be tricky, especially when it involves moving parts that don’t stop just so you can get your feet under you. For this reason, we’ll end on the note we’ve already mentioned many times, just as one last reminder: Switch now, so you can have time and leeway to familiarize yourself.
Happy metric-ing!