We’ve discussed A/B testing before, but if you’re unfamiliar, it’s essentially a fancy name for a controlled experiment to test specific variables related to your site, ads, or other components of your online presence. Examples of variables you might test (albeit one at a time with other variables controlled for, because we’re scientific here) include ad creative such as copy or design, audiences whom you’re targeting, timing of ads, and loads of others.
The category of ad can get especially granular, with specifics you can test including (but not limited to):
- Ad type (video vs static image)
- Design
- Headline
- Primary text
- Call to action
These are of course not comprehensive, just common variables to test.
We should also note that many platforms offer “official” A/B testing through their system, but you can also manually A/B test on anything. In these cases, you just change one of the variables — only one! It’s controlled! It’s science! — in your regular campaign, ad, site, whatever, and then review the results after a set period of time (we recommend two weeks or more). Even though it won’t be automated or presented through a fancy platform, it’s still just as valid.
Today we’re gonna focus on A/B tests specifically for Facebook and Instagram advertising.
First up: Setting it all up.
Getting started on your A/B test
Facebook offers its own automatic A/B testing system, so you can either choose to do your testing through this or manually.
The standard method they recommend is to use the Ads Manager Toolbar, through which you can begin a test. This tool will automatically apply your chosen variable alteration to an existing campaign or ad set.
Their basic step-by-step guide can be seen here to walk you through setting it up.
Otherwise, there are a few guiding principles to follow.
Most importantly (we’ll probably yell about this a couple more times before the end of this blog post) is to never ever ever test more than one variable at once. Otherwise you’re just messing around clicking on a load of settings and creating a stew of invalid, uninterpretable mess.
Also, you’ll want a sufficient enough budget for your test to make sure you get a large enough sample size to have both clear and valid results. The specifics depend on your scale, but generally we recommend you spend no less than $30 a day for each ad.
You can also use an A/B calculator to help understand the bottom-line of your results. We like this one from Neil Patel.
Understanding your results, with real-life examples
After you’ve run your test for enough time and gained data that can be deemed statistically significant, it’s time to interpret what you’re looking at.
If you’re clear heading into the test about what you’re looking for — and you should be — there will be certain times where it only takes a second of looking at the results to understand generally which test group was the winner. Sometimes, however, it will be closer. Either way, you’ll want to dig in deeper to make sure you don’t just know who “won,” but can extrapolate more from that.
To that end, along with manual interpretation, we’ll be coming back to that A/B calculator mentioned earlier.
Our first example comes from an A/B test for two different vehicle types[1] .
To make sure results were valid and not affected by other variables, everything else was controlled for other than the product. Both campaigns ran for the same duration, had the same budget, targeted the same audience, had the same objective setting, and so on.
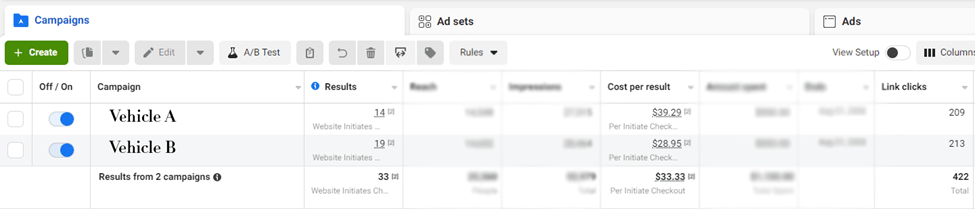
Image taken from Facebook ads manager
After the test was run, we saw that vehicle A converted 14 times and generated 209 clicks to the site, while vehicle B converted 19 times and generated 213 site clicks. Vehicle A then had a CPA of $39.29 while vehicle B’s was $28.95.
Immediately, we can see that vehicle B performed better. With some quick math, we know that the conversion rate for people clicking on the ads for vehicle B was 9%, whereas vehicle A yielded a 7% conversion rate.
Further, with the A/B testing significance calculator (or your own math if you’re into that), we can quantify that performance as a 34% improvement.
Our second example was testing not products, but copy — specifically short form versus long form for a company’s Facebook ads. Once again, all other variables were controlled for.
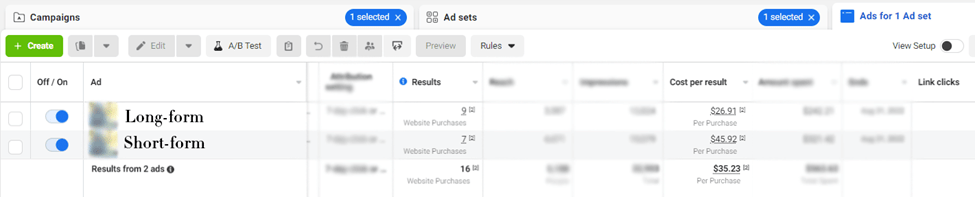
Image taken from Facebook ads manager
After the test was done, the long form returned nine purchases and 54 site clicks with a CPA of $26.91 while the short form saw seven purchases, 55 clicks to the site, and a CPA of $45.92.
On one hand, we can see the long form copy saw better results — 31% better conversion, in fact — and we’d likely want to proceed with the long form ads moving forward. On the other hand, the sample size is low enough given the relatively narrow gap in raw numbers that there’s a chance this isn’t significant enough to put all your eggs in that basket.
With that in mind, it wouldn’t be a bad move to continue this test further to gain statistical significance and corroborate what we’re seeing. Even if you were to not extend this test, it would be wise to keep that in mind moving forward; should that rate increase or decrease significantly, you’ll have a good idea why.
Our last example was testing audiences for an Instagram Reel ad. Everything else was controlled for, and we distributed the ad to four different audiences; two were different interest-based audiences, while two were lookalike audiences[2] — one for those who’d engaged with the company’s Instagram account, one for those who’d engaged with their Facebook.
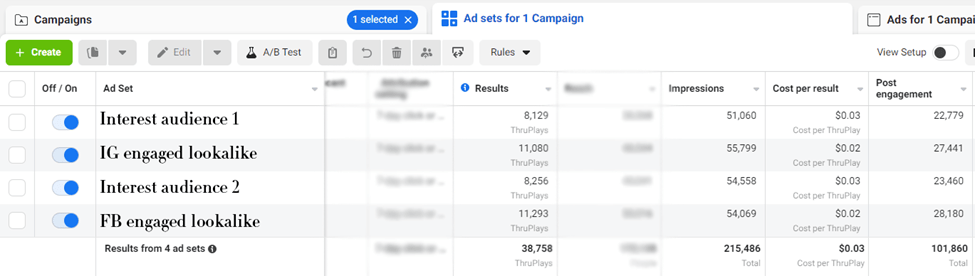
Image taken from Facebook ads manager
In this test, the audiences performed roughly the same. However, the fourth audience — lookalikes of users who had engaged with the company’s Facebook page — saw the highest amount of people watching at least 15 seconds of this Reel, and subsequently the most engagements.
With the amount of visitors each audience generated plus their amount of conversions, we can see that the fourth audience did indeed convert 32% better. Even better, unlike the last test example, this difference relative to the volume of data is much more statistically significant and you can proceed quite confidently with what you’ve learned here.
As we hammer on about endlessly, testing your work is critical to understanding what you’re doing right, how it’s right, and how to improve. It’s a cornerstone of what we do at Fujisan — because it should be a cornerstone for all businesses’ digital marketing.
And one more time: Always remember to control your variables!