What is Performance Max channel reporting?
PMax channel reporting is a new report that breaks your Performance Max results down by channel — search, shopping, YouTube, display, discover, GMail, and Google Maps. Instead of reporting being all lumped together, now you can see the individual channels and compare.
This is currently being rolled out as of 2025 — its availability may still show as “beta” in some accounts — and is designed to show how each channel is contributing to your conversion goals. It also includes visualizations and a channel distribution table, to help you better understand and contextualize results. This will provide more transparency for media-mix insight, better visualization, and smarter optimization paths.
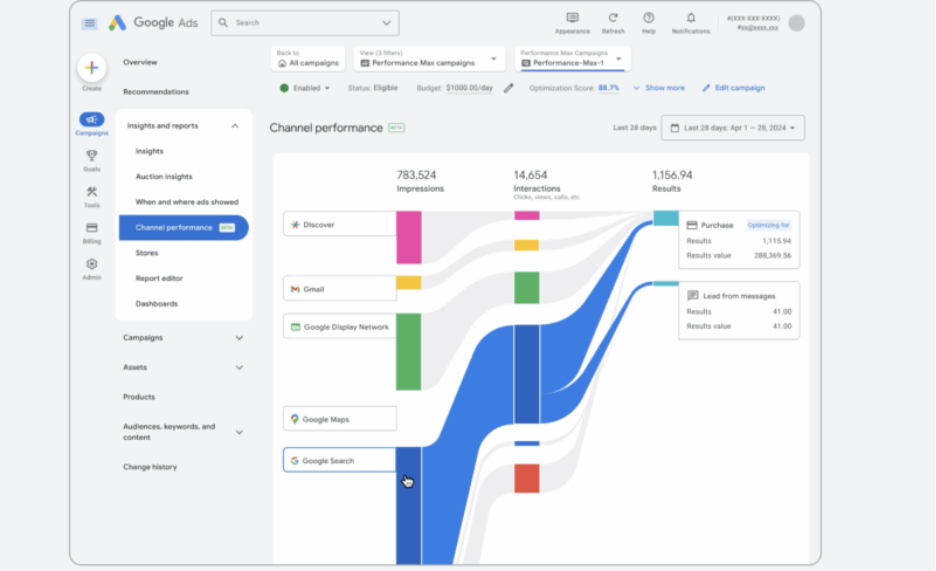
Image Source: https://searchengineland.com/google-performance-max-channel-search-asset-insights-454695
Starting out: where to find it (and other things to know)
To get to Performance Max channel reports, first head over to Google Ads. From there, in order, click:
- Campaigns
- The Performance Max campaign you’d like to see
- Insights and reports
- Channel performance
Under “channel performance,” you’ll find your Performance Max channel reports. Note this is different from placement reports, which only show location lists by impression but don’t include conversion data. Both are useful and can help contextualize each other.
Channel reports further complement asset group reporting, which show performance at the creative bundle level.
Channel reports metrics and how to read them
The metrics you’ll see under a Performance Max channel report include:
- Channel-level impressions
- Clicks
- Cost
- Conversions
- Conversion value
These really help inform your return on ad spend and cost-per-click by each channel, an insight not previously offered by Performance Max.
You’ll see here that you can really drill into the relationship between channel and ad format — for example, video versus product feed — to spot gaps in creative and media. Is one channel underperforming relative to others? Or is another channel doing disproportionately well? This may present an opportunity to improve and optimize, say, creative, or to learn from what’s working right in one channel and see what your takeaways can be and how they can be applied elsewhere.
Turning channel data into strategy
So, how do we take these channel-by-channel insights and use those to inform a wider strategy?
As a starting point, begin by mapping channels to their corresponding roles in the marketing funnel (or “consumer journey funnel,” whatever you call it). For example, usual findings may include these channels corresponding to these funnel roles:
- YouTube and display ads: awareness and creating demand
- Discover and Gmail: consideration
- Search and shopping: conversion
- Maps: local intent and in-person store traffic
After establishing these, set performance benchmarks based on historical performance, establishing channel-specific KPIs for future reference — for example, cost-per-view and click-through rate for awareness, cost per acquisition and return on ad spend for conversion/capture and the channels that are most-affiliated with those funnel roles.
From there, apply your learnings to audience signals — and exclusions!
If a channel is over-serving on low-intent traffic — for example, display ads driving poor-quality leads — refine audience signals toward in-market and custom segments aligned to your goal. At the same time, use negative keyword lists and placement exclusions to protect your budget from irrelevant searches or low-quality sites.
Diagnosing performance shifts with channel reporting (and steps to take from there)
Now, how does Performance Max’s channel reporting allow you to more clearly see shifts in performance? Here are steps you can take to diagnose these changes:
- Investigate placements for outliers, i.e. site (or app) placements with a lot more impressions than others. From there, cross-check to see if this change is account-wide or isolated to one PMax campaign. If the latter, what can you extrapolate from that? Can those findings be applied elsewhere?
- Cross-examine channel changes with search term report and asset fatigue. Correlations here can help you identify any patterns that might suggest it’s a good call to reorganize audience signals and/or negative keyword exclusions.
- Check asset group insights for dips in asset performance. This is especially helpful if a high-performing video or feed image was paused or replaced.
- Examine and rule out potential external variables such as seasonality, promotions, or any events that could impact short-term demand.
Limitations and caveats
Lastly, other things to consider:
- This provides far greater transparency, but less control — you can see different channels’ performance but can’t directly bid or target per channel in Performance Max due to its automated nature. So, set your expectations accordingly. Insights can help drive your decisions for PMax “audience signal” updates, or might indicate that your creative may need to be updated or tweaked. This can also help inform shifts in overall user demand. Overall, though, your control is limited.
- Its’ beta status means the UI and metrics could evolve. Always note the date range and attribution model in reports to make sure you’re accurately understanding what you’re seeing.
- If you’re a marketer working with a client — as opposed to someone doing marketing in-house for your business — use native exports to build client-facing visuals that clearly communicate how channels are tied to business goals, like revenue, qualified leads, etc.
Overall, Performance Max channel reporting is a new tool that, while it has limitations, can provide you with lots of insights upon which to build your campaigns. The most important aspect is utilizing it not as a be-all-end-all solution, but one of many tools that to use in conjunction with each other.