Back in Ye Olden Times (like, 2019), creating a custom report was pretty dang easy: hit the “customization” tab… boom, you’re golden.
Now with Google’s switch to GA4, this has become an unfamiliar task for most people marketing their business. It can feel like a pain and like you have to relearn everything from scratch again. Luckily, that’s exactly what we’re gonna cover.
A quick intro to GA4’s custom reports (and why they matter)
Within GA4, there are standard reports pre-configured into the dashboard already — these are of course useful on their own, but these reports don’t offer up everything needed by everybody. For many marketers, they’ll find there are insights especially relevant to them that aren’t offered up in these standard reports.
The pre-configured reports are pretty good foundations, but they’re supposed to be generally useful to a broad audience. Subsequently, it makes sense that with different businesses and campaigns having different marketing needs, they’d have different insight needs too. Hence why custom reports are so useful; a car dealership will have different needs than a business-to-business software, which will have different needs than an independent print-maker — hence, their insights should reflect that.
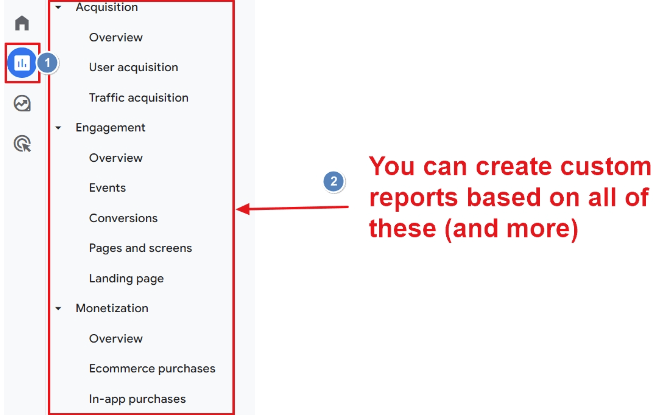
In GA4, custom reports are ones you create to view specific insights most relevant to go beyond the boilerplate insights offered otherwise. These can include dimensions like session metrics, new user metrics, goal completions, etc.
Image Source: datadrivenu.com
The importance of crafting a good custom report is in many ways self-explanatory: generic insights only offer a generic understanding of your campaign.
Conversely, there are so many more events and event parameters in a custom report.
A custom report, tailored towards your needs, helps you better understand your campaign performance; it offers greater detail into what’s working with your website (and what’s not), and helps you understand your message’s effectiveness, your audience, their conversion funnel, and every step thereof.
Furthermore, custom reports, while less straightforward in GA4 than in Universal Analytics, are still easy even for beginners. You really don’t need to be a tech wiz to take advantage of them, and all these benefits together allow you to make faster, more decisive, and more efficient business decisions in response.
A note before going over how to create a custom report: The four types you can build
As stated, there are four different formats of customizable reports. Which you use depends on your needs, but they are:
- Explorer
- Flat table
- Map overlay
- Funnel
Explorer is the standard type of report in GA4. This format includes a line graph and table to better visualize data. They also provide search and sort capabilities plus secondary dimensions to hone in on specifics.
Flat table is what it sounds like: a static table — data visualized in rows — through which you can sort.
The map overlay is where we get into more specific needs; for some, it might be extremely valuable, for others not so much. This format displays different countries (or regions) and darkens them depending on how much engagement or traffic they’re generating.
Lastly is the funnel, which is a graph visualizing users’ conversion funnel regarding your site. You get to define the steps within the funnel, and in return, it can show you if there are any disproportionate drop-offs between one stage to another. This can be sneakily super helpful for keying in on what you’re doing well and conversely where you’re losing people.
Most marketers will be using the explorer reports more often than not — but we’d be remiss not to mention the others, too, because when they’re relevant, they’re really relevant.
How to create a GA4 custom report
Here you’ve got two different options: a custom report made from scratch — what most people will have to do — or taking an older custom report and saving it as a new one. The latter might be a helpful way down the line, but at this point, most of us haven’t even created one custom report in our GA4 dashboards, so will have to start from the beginning.
At Fujisan, our recommended flow for determining the scope and focus of your custom report is as follows:
- Define your campaign and data needs and identify the corresponding metrics you’ll need access to understand their future success (or lack thereof).
- Check if existing standard reports provide satisfactory insights regarding this data you’ve identified as critical — if a standard report exists that gives you all this, you’re golden! Why make extra work for yourself? Use that!
- If not, build your custom report (more on that below).
- Save your report and add it to your GA4 navigation menu.
As for the step-by-step of actually creating the report, it goes as follows:
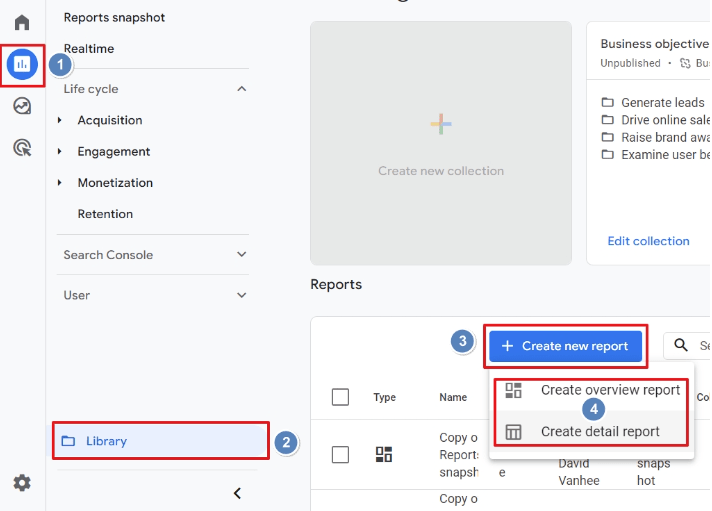
- In GA4, select “reports,” then “library,” and finally “create a new report.”
- Enter your new report’s title, and then select your type.
- Define your metrics and dimensions, then hit save.
Image Source: datadrivenu.com
Technically, you have now created a custom report. It’s simple! But there’s more.
This starts with also choosing one of “create overview report” or “create detail report.”
For this example, we’ll go with “create detail report,” where we’ll choose a blank template and start adding relevant metrics and dimensions.
Image Source: datadrivenu.com
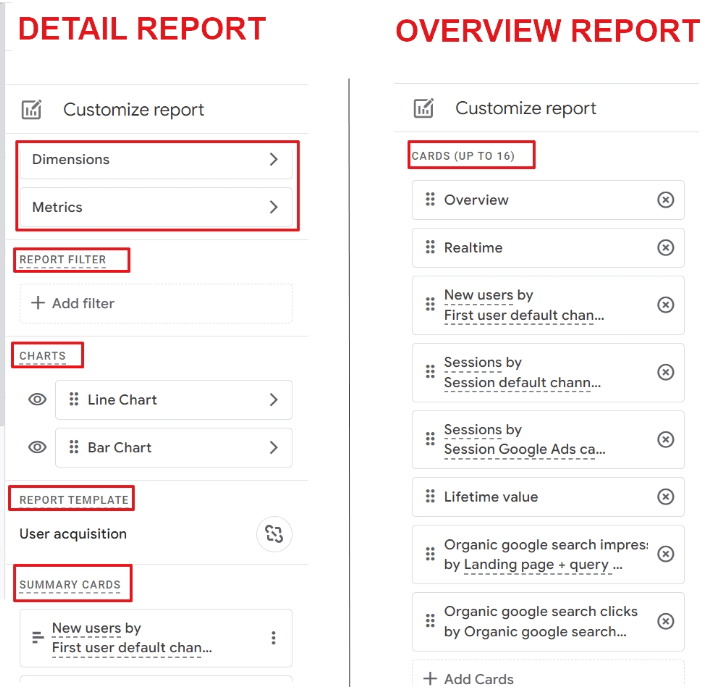
The detail report option has a fixed layout — two charts and one table — and you can only use two dimensions versus adding extra elements to the report.
This might sound like it’s not all that customized for a custom report, but once you dive into the report customize panel, you’ll see this isn’t the case — it is actually very customized, giving you many options within these limitations that, in the end, actually help keep the visualization clear. It’s like how a pizza is best if you don’t throw 20 different toppings on it because, no matter how much you love those toppings individually, they just end up drowning each other out into a giant, undefined flavor where nothing stands out. Is that a super clunky metaphor? I mean… sure, but still true.
(And on a side note, we recommend saving a copy of this report you’re customizing first, as a baseline to compare to.)
Overview custom reports, meanwhile, are ideal for “at a glance” insights.
An overview custom report allows you to have up to 16 different metrics a user can report on. You can naturally turn this into a custom report — a good call — but make sure to save it as a new report and name it accordingly so you can still have the general overview Google provides as the basis to create more reports.
Overall, it’s completely reasonable that many of us are lamenting the end of Universal Analytics and the switch to GA4. It was familiar and we got it.
But in the end, GA4 really does offer a ton of flexibility that wasn’t available in the past; now you can modify reports to make them work the best for you, instead of the other way around. While change and adapting can be a pain in the moment, we believe everyone will find that once they’re used to GA4, there’s a lot we can do with it that wasn’t possible before.


